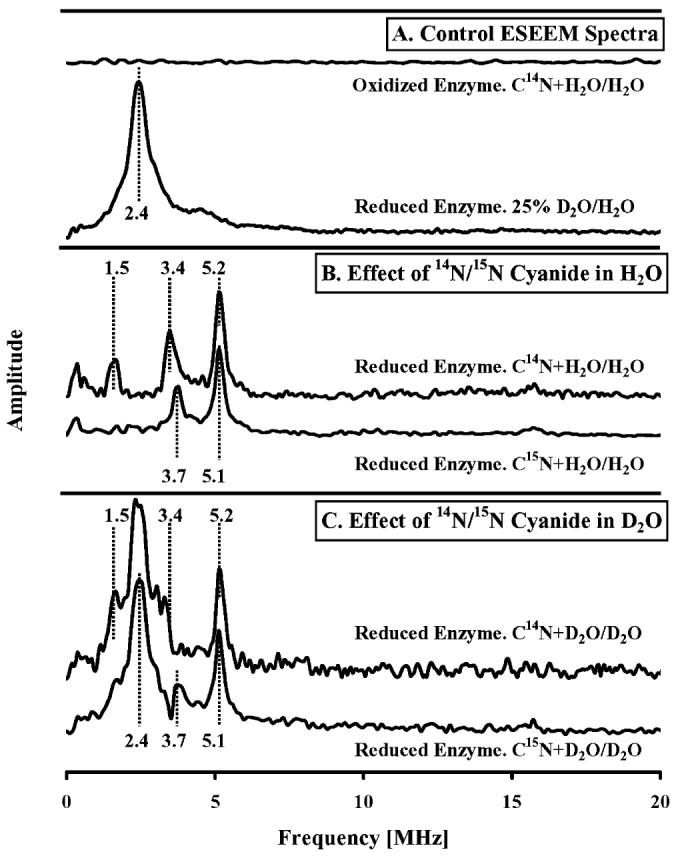
Figure 3.

Effect of 14N and 15N cyanide on the Mn ESEEM spectra of R.s. oxidase in H2O and D2O. Ratioed ESEEM spectra obtained for (A) oxidized oxidase + C14N/oxidized oxidase in aqueous buffer (top trace); reduced oxidase in 25% D2O buffer/reduced oxidase in H2O buffer; (B) reduced oxidase + C14N/reduced oxidase in H2O buffer (top trace); reduced oxidase + C15N/reduced oxidase in H2O buffer (bottom trace); and (C) reduced oxidase + C14N/reduced oxidase in 75% D2O buffer (top trace); reduced oxidase + C15N/reduced oxidase in 75% D2O buffer (bottom trace). Conditions common to these measurements were as follows: sample temperature, 4.5 K; microwave frequency, 9.68 GHz; magnetic field strength, 3700 G; pulse sequence repetition rate, 1 kHz. ESEEM data were collected using a three-pulse (stimulated echo) sequence of 90°–τ–90°–T–90° with 90° pulse widths of 16 ns (fwhm); tau value, 128 ns; integration window, 24 ns. Common sample conditions were 90 μM R.s. oxidase, 100 mM K+-HEPES, and 4 mM KCl, pH 7.0; cyanide, 5 mM; dithionite, 10 mM.
