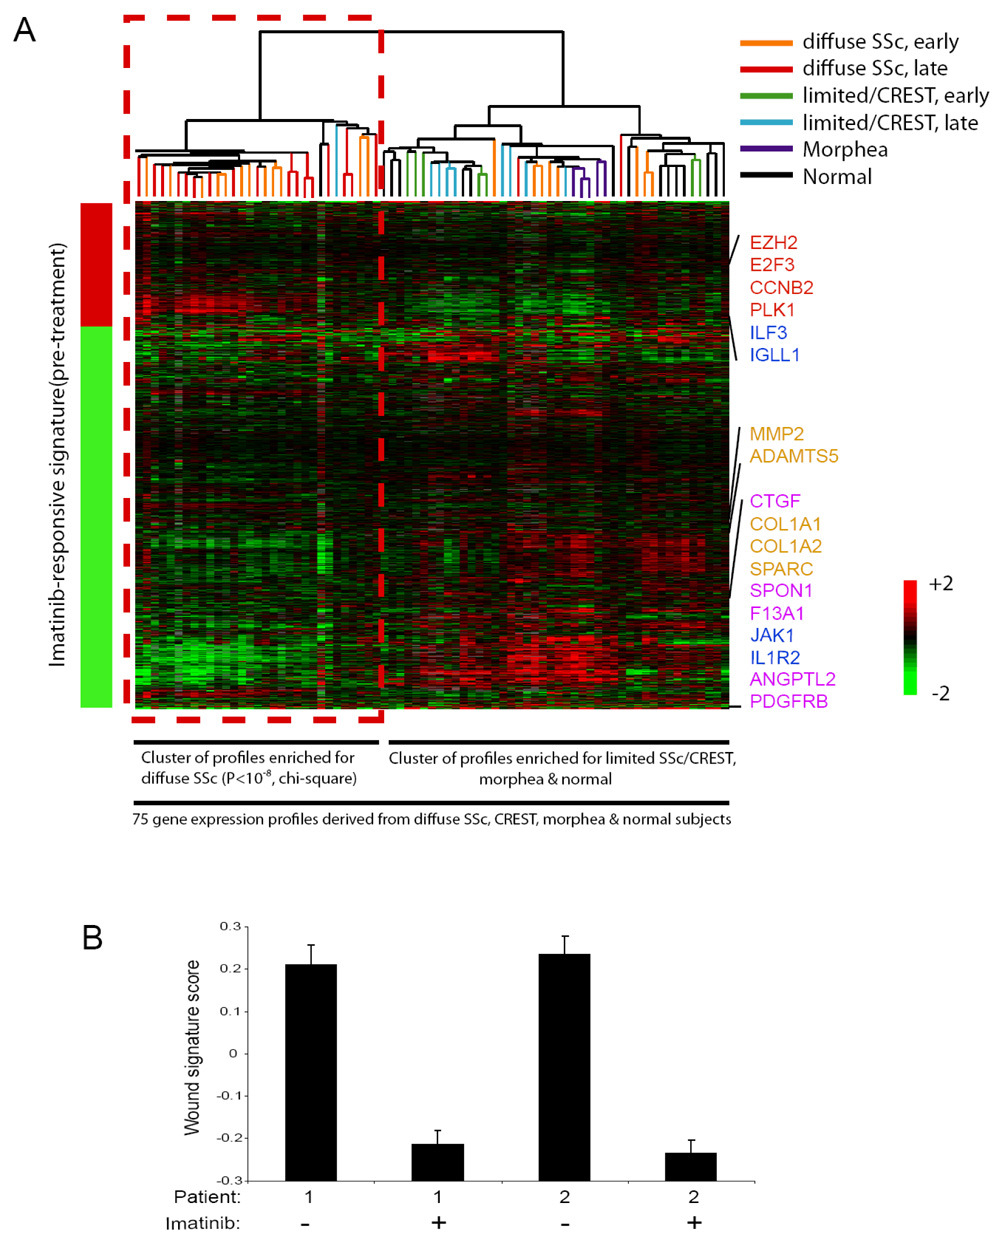
Figure 3. An imatinib-responsive signature is present in most diffuse SSc.
(A) The imatinib-responsive signature was determined by applying Significance Analysis of Microarrays (SAM) to identify mRNA that exhibited statistically significant changes in their levels in pre-treatment as compared to post-treatment skin biopsy samples derived from the two imatinib-treated SSc patients. SAM identified 1050 genes that were changed by imatinib therapy in both patients (FDR<0.001), and this imatinib responsive signature is represented by the bar to the left of the heatmap image (red represents an increase, and green a decrease, in mRNA expression post-treatment; the genes comprising the imatinib responsive signature are presented in Supplemental Table 1). The imatinib-responsive genes were then used to organize via unsupervised hierarchical clustering the 75 gene expression profiles derived from skin biopsies from SSc, limited SSc/CREST, morphea and health control patients contained in a database. The results of the hierarchical clustering are presented as a heatmap, with each column representing the mRNA profile of a sample, and rows representing the genes present in the imatinib responsive signature. Unsupervised hierarchical clustering revealed two distinct clusters, with the imatinib-responsive gene expression pattern being similar to one of the clusters, and this cluster being highly enriched for diffuse SSc samples (29 out of the 31 gene expression profiles contained in this cluster are from diffuse SSc, P<10−8, chi-square). This cluster of gene expression profiles derived from most of the diffuse SSc samples exhibited a pattern of gene activation and repression concordant with the imatinib-responsive signature, including alterations in the expression of genes involved in cell proliferation (red), immune signaling (blue), matrix remodeling (tan), and growth factor signaling (pink) (indicated to the right of the heatmap). The other cluster contained most of the profiles derived from limited/CREST, morphea and normal subjects, and the gene expression profiles from these patients did not exhibit the imatinib-responsive signature (this cluster contains 44 gene expression profiles, including 14 from normal skin, 15 from limited SSc/CREST, 5 from morphea, and 10 from diffuse SSc). (B) Reduction in the wound signature by imatinib in two patients with SSc. Replicate array analysis was performed for each sample; mean ± standard deviation is shown.

