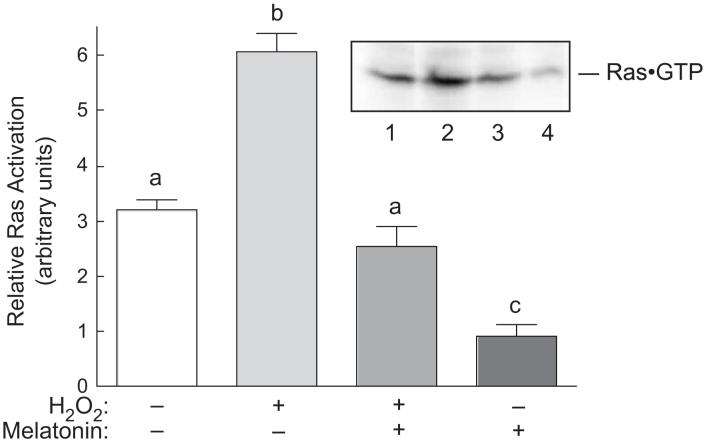
Fig. 3.
Ras activation in response to H2O2 and/or melatonin in H4IIE cells. Cells were treated as described in the legend to Fig. 2, lysed, and ras·GTP complexes were isolated from cell homogenates as described under “Materials and Methods”. The amount of ras present in the isolates was measured by Western blot analysis. A representative blot is shown in the inset. Lane 1, control cells; lane 2, cells incubated for 60 min with 0.5 mM H2O2; lane 3, cells incubated for 60 min with 3 mM melatonin followed by a 60 min incubation with both melatonin and H2O2; lane 4, cells incubated for 2 h with 3 mM melatonin. Bars not sharing the same letter are significantly different, p<0.05.

