
Figure 1.
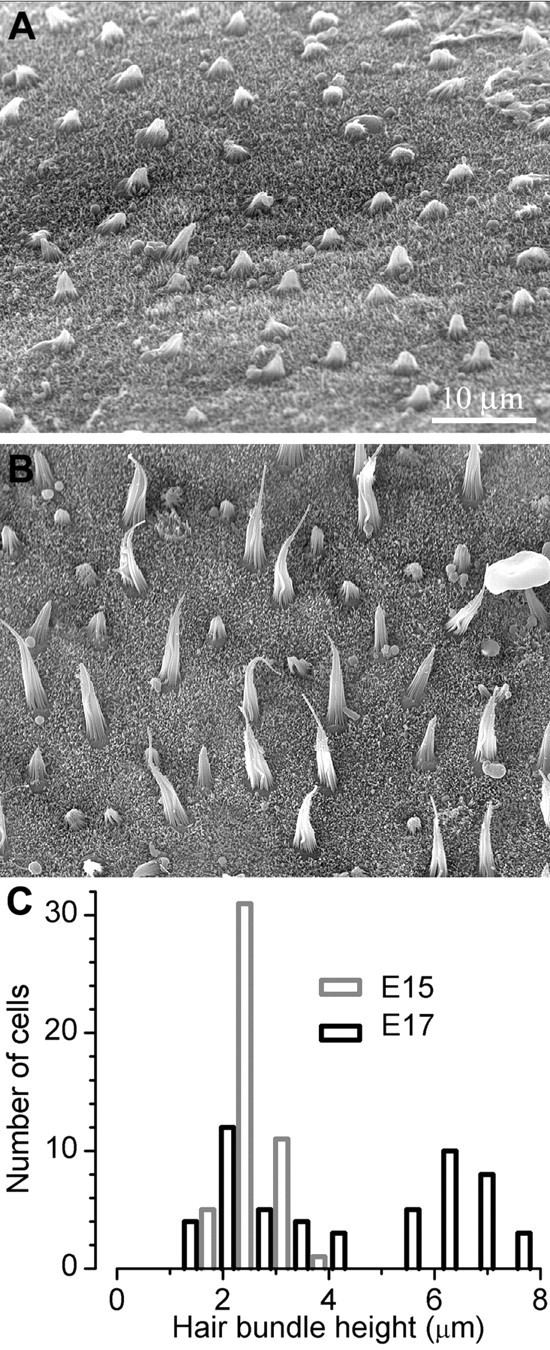
Scanning electron micrographs of embryonic hair bundles. A, Image of the sensory epithelium from the central region of an E15 mouse utricle. Forty-eight hair bundles are visible in this image. Scale bar: A, B, 10 μm. B, SEM of the central region of an E17 mouse utricle. Hair bundles from both the first (tall) and second (short) wave of hair cell differentiation are visible. Note the red blood cell (∼8 μm) in the upper right for scale. C, Histogram of bundle heights measured at E15 and E17. Bundle height was measured directly from the SEM image and taken to be the distance from cuticular plate to the tip of the tallest stereocilium. Bin width, 0.7 μm.