
Figure 5.
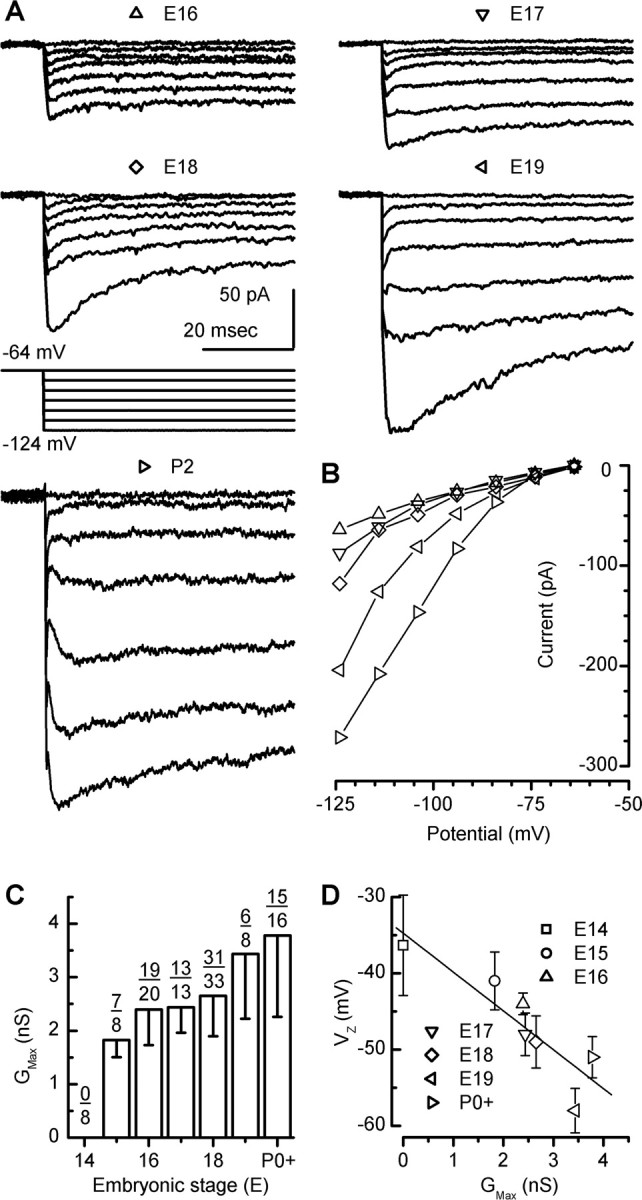
Representative families of inwardly rectifying currents at several developmental stages. A, Current families were evoked by series of 60 msec voltage steps that ranged from -124 to -64 mV in 10 mV increments (see protocol inset). Calibration applies to all datasets. B, Peak I-V relationships for the data shown in A. C, The bar graph shows the mean maximal conductance for the inward rectifier at each embryonic stage. Only cells with GK1 were included in the mean. Error bars show SD. The fraction indicates the number of cells with GK1 over the number of cells examined at each stage. D, Zero-current potential plotted as a function of the mean ± SE maximum inward rectifier conductance for each embryonic stage. The line represents a linear regression fit to the data points.