Figure 6.
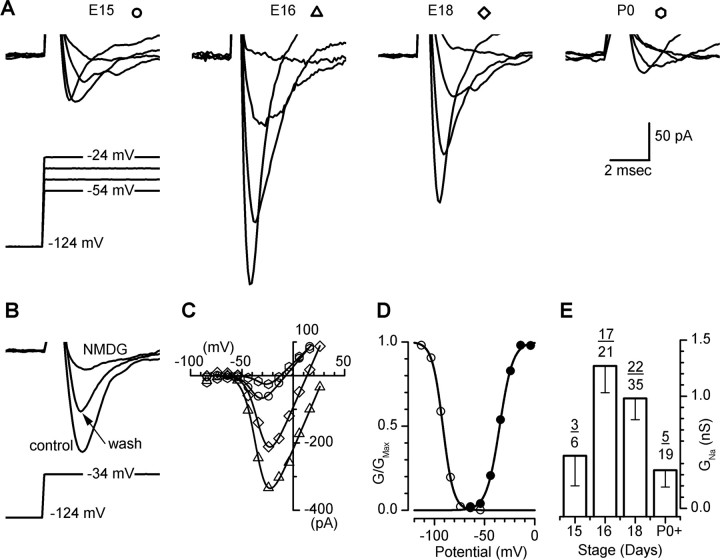
Transient acquisition of a voltage-gated sodium conductance. A, Representative families of sodium currents at several developmental stages. The voltage protocol (inset) and calibration apply to all families. Outward capacitive transients have been truncated for clarity. B, Current traces in control solution after exchange of external Na+ for NMDG+ and after washout revealed that the currents were carried by Na+. The step protocol is shown below. Calibration of A applies. C, Peak currents from the data in A were plotted as a function of voltage and fit with Equation 3 (lines). D, An activation curve was generated using the peak currents plotted in C (E16 data) divided by the driving force for Na+. The data (filled circles) were then fit with Boltzmann Equation 2. An inactivation curve for the same cell was derived from the peak currents evoked by a step to -34 mV, which was preceded by steps to prepulse potentials that ranged from -124 to -44 mV. The currents were divided by the Na+ driving force, plotted versus prepulse potential, and fit with a Boltzmann relation (open circles). E, The mean ± SD maximal sodium conductance at several developmental stages. The numbers indicate the number of cells with a sodium conductance over the number of cells examined at each stage.

