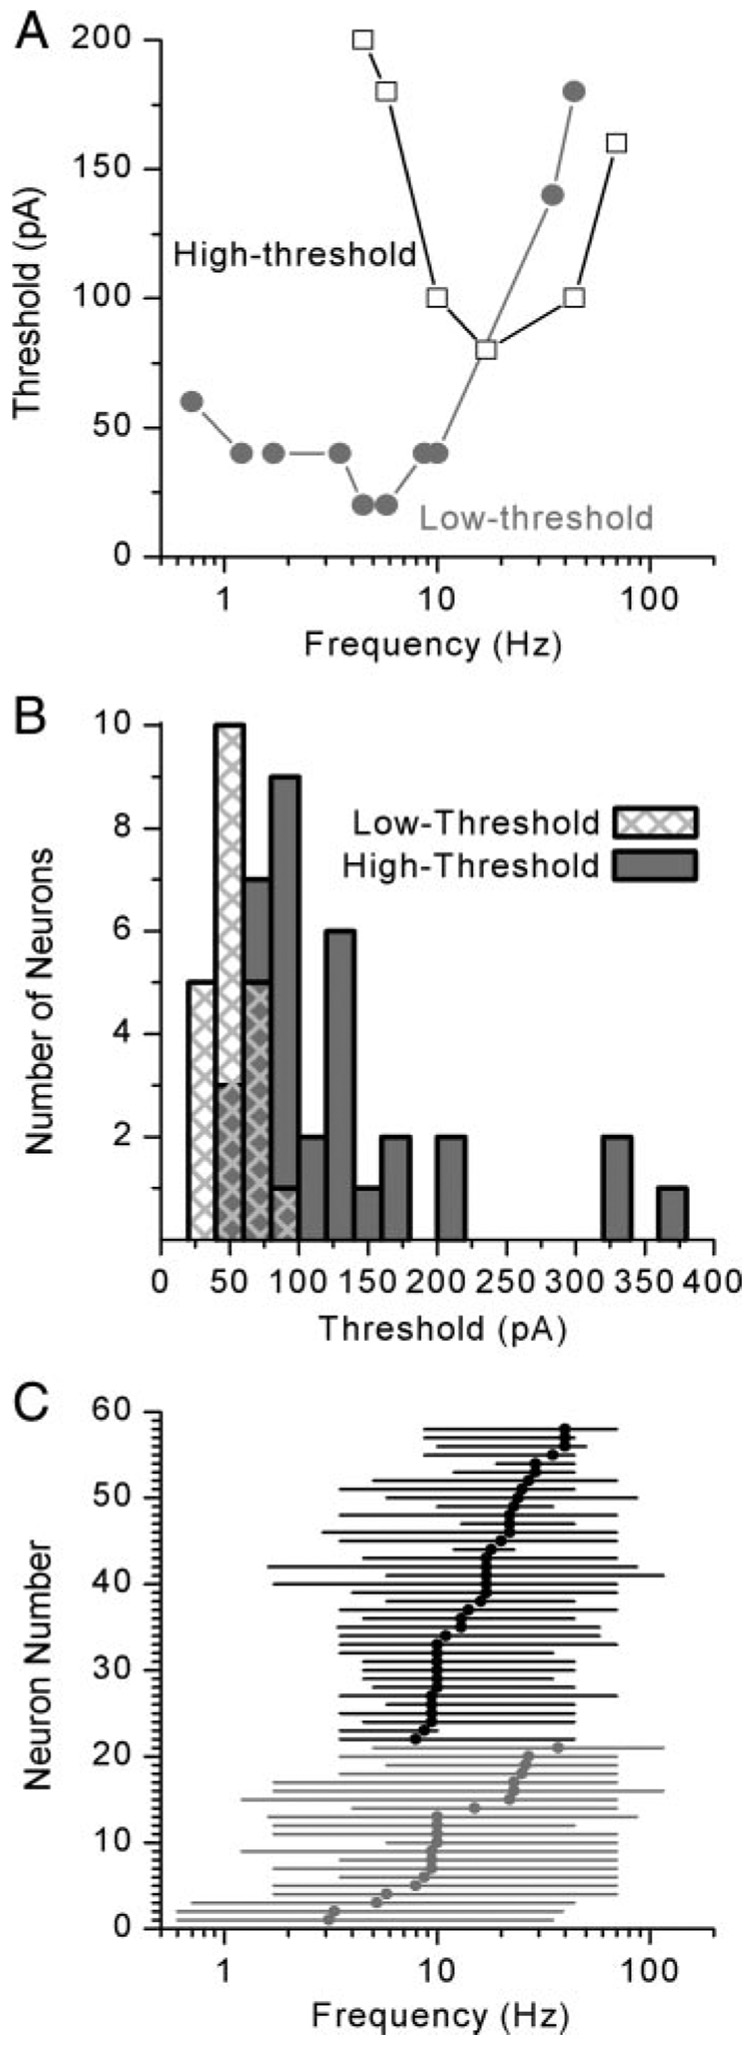
FIG. 4. Tuning characteristics of vestibular ganglion neurons.
A: tuning curves for representative low- (gray) and high-threshold (black) neurons. Low-threshold neurons required less current to evoke an action potential and often fired at lower frequencies than high-threshold neurons (Low-threshold: Cell 20030717E, P2; High-threshold: Cell 20030514A, P2). B: histogram illustrating the threshold for action potential generation for low- (gray bars) and high- (black filled bars) threshold neurons. Low-threshold neurons had a mean threshold of −43 ± 17 pA (n = 21); −129 ± 107 pA (n = 36) for high-threshold neurons. C: sensitive range (lines) and best frequency (symbols) are plotted for each neuron. Low-threshold cells are shown in gray and high-threshold cells in black. Low-threshold neurons were more broadly tuned, with a mean sensitive range that spanned 67 ± 16 Hz (n = 21), whereas high-threshold neurons had a mean sensitive range of 49 ± 21 Hz (n = 37).

