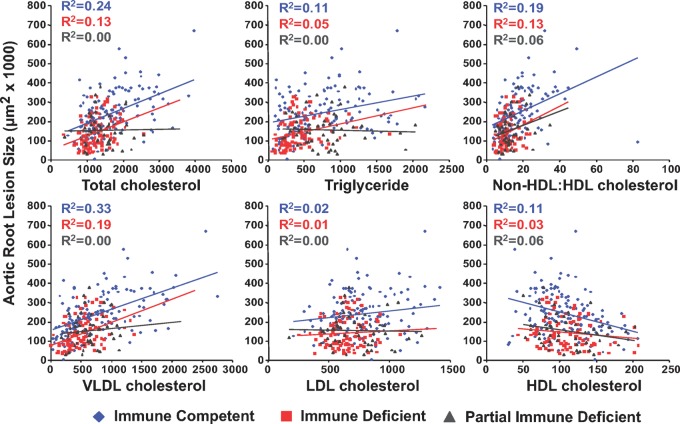
Fig. 4.
Subgroup analysis based on adaptive immune status. Each graph plots the lipid variable (mg/dl) against the resultant aortic root atherosclerosis for adaptive immune competent (blue diamonds), adaptive immune-deficient (red squares), and adaptive immune partially deficient (gray triangles) mice. Each color coded linear regression (blue for adaptive immune competent, red for adaptive immune deficient, and gray for adaptive immune partially deficient mice) has the corresponding squared correlation coefficient (R2 value) displayed.

