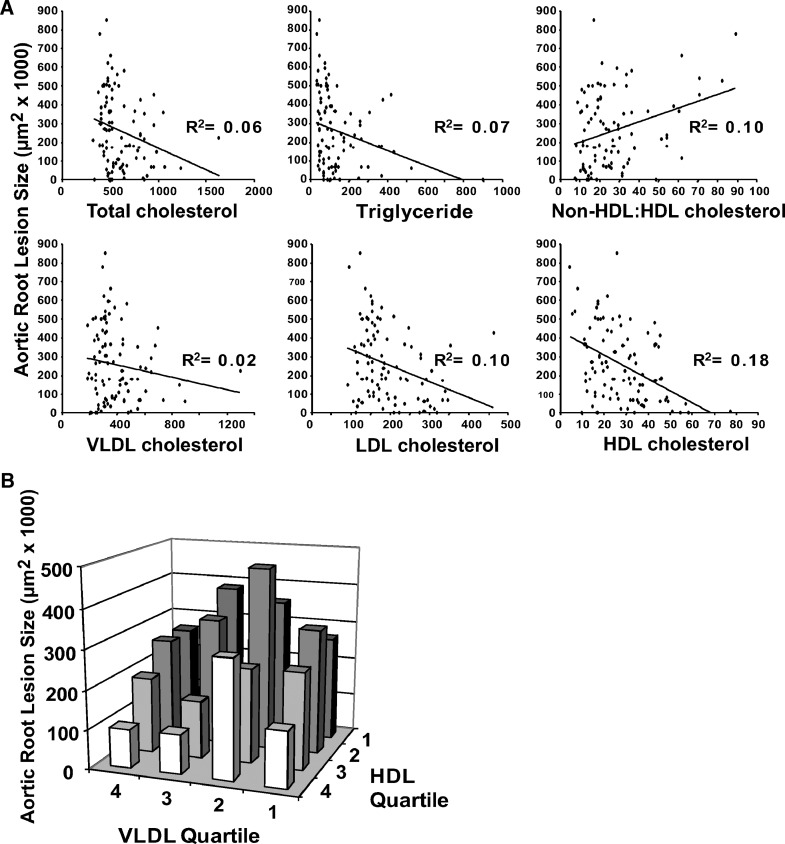
Fig. 6.
ApoE−/− mice. A: Analysis of aortic root atherosclerosis. Each graph plots the plasma lipid level (mg/dl) against the resultant aortic root atherosclerosis and has the corresponding squared correlation coefficient (R2 value) displayed. B: Progressive quartiles for VLDL cholesterol and HDL cholesterol and the corresponding aortic root atherosclerotic lesion size are plotted.

