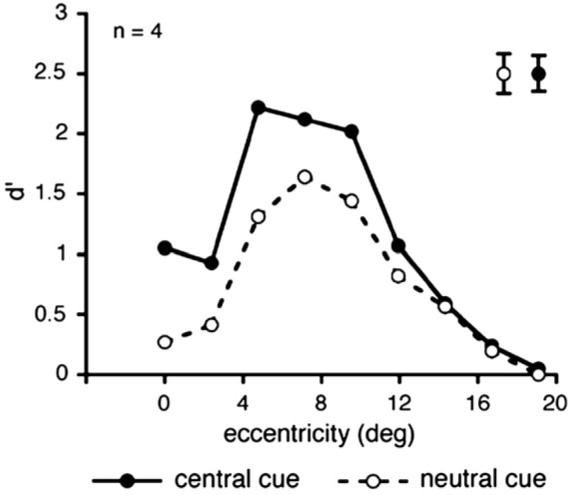
Fig. 8.

Average d′ across observers as a function of target eccentricity and cue type (central cue vs. neutral cue) in Experiment 4. Larger texture scale (50 cm viewing distance). Notice how the scale on the abscissa is doubled compared to Fig. 7. In the neutral condition (open circles, dashed line), performance peaks at 7.2° of eccentricity and drops towards more central and more peripheral locations, replicating the central performance drop. Doubling the texture scale shifted the peak of performance to more peripheral locations. Precueing the target location with a central cue (filled circles, continuous line) improved performance across eccentricity. Error bars are indicated in the upper right of the graph and represent ± 1 SEM per cueing condition, averaged across eccentricities.
