
Figure 1.
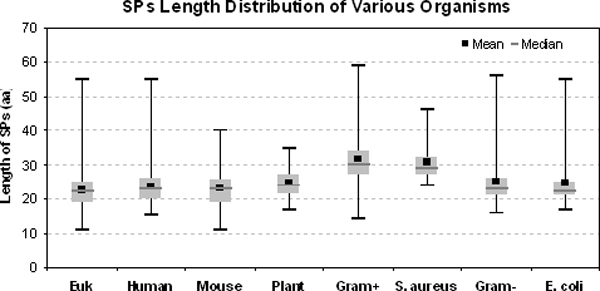
Boxplot illustrating the SPs distribution found in selected organisms and groups (Eukaryotes, Gram-positive and Gram-negative bacteria). Mean length (■) and median (-, grey bar) values are indicated.
Official websites use .gov
A
.gov website belongs to an official
government organization in the United States.
Secure .gov websites use HTTPS
A lock (
) or https:// means you've safely
connected to the .gov website. Share sensitive
information only on official, secure websites.
Boxplot illustrating the SPs distribution found in selected organisms and groups (Eukaryotes, Gram-positive and Gram-negative bacteria). Mean length (■) and median (-, grey bar) values are indicated.