
Figure 5.
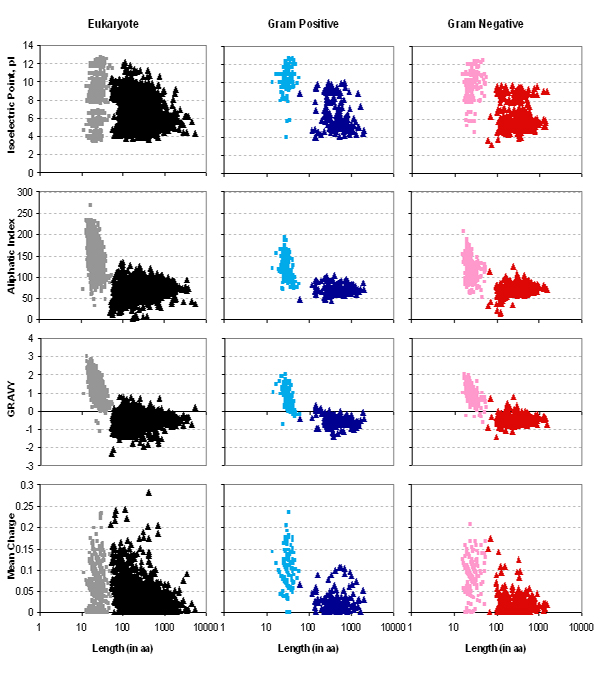
Comparison of the isoelectric point (pI), aliphatic index, GRAVY value and mean charge among the three organism groups. Data are represented by squares which denote SP while triangles denote MP.
Official websites use .gov
A
.gov website belongs to an official
government organization in the United States.
Secure .gov websites use HTTPS
A lock (
) or https:// means you've safely
connected to the .gov website. Share sensitive
information only on official, secure websites.
Comparison of the isoelectric point (pI), aliphatic index, GRAVY value and mean charge among the three organism groups. Data are represented by squares which denote SP while triangles denote MP.