
Figure 1.
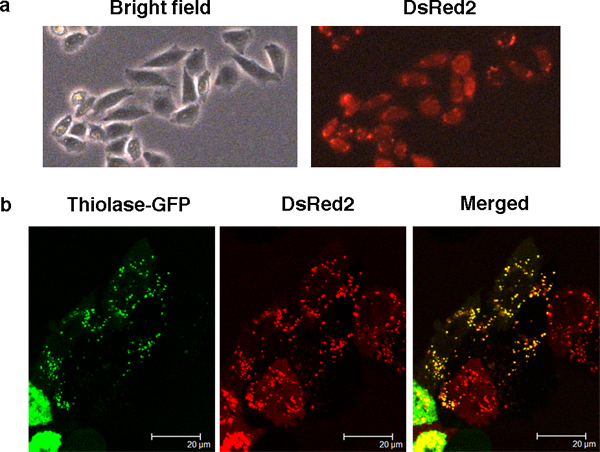
Microscopy of CHO-perRed peroxisomal marker cells. A. Bright field and fluorescent images of CHO-perRed cells obtained by fluorescent microscopy (original magnification, 100 ×). B. Laser scanning confocal microscopy images (original magnification, 630 ×) of GFP-fused Acaa1 (green) and DsRed2 (red). The merged images (yellow) indicate co-localization of Acaa1 and DsRed2.