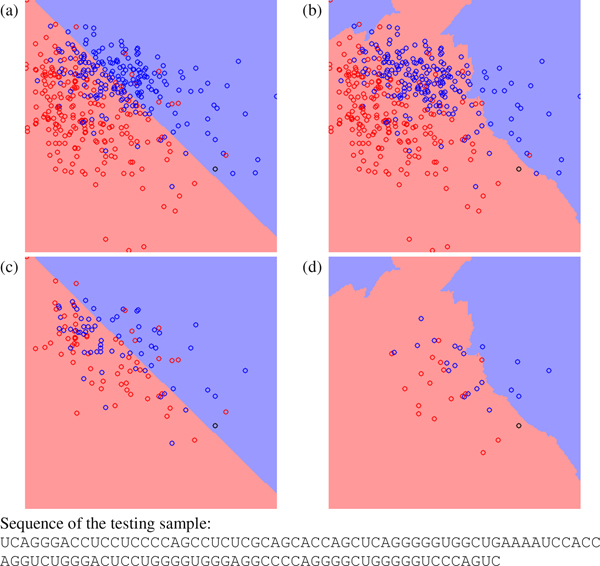
Figure 4.
The decision boundary plots, where (a) and (c) are generated by SVM and (b) and (d) are generated by RVKDE. The x-axis is frequency of the dinucleotide "GG", and the y-axis is ratio of the minimum free energy to the sequence length[46]. The black circle is a testing pseudo hairpin. The red and blue circles represent positive and negative training samples. In (c) and (d), training samples not involved in the decision function of the classifiers are removed.

