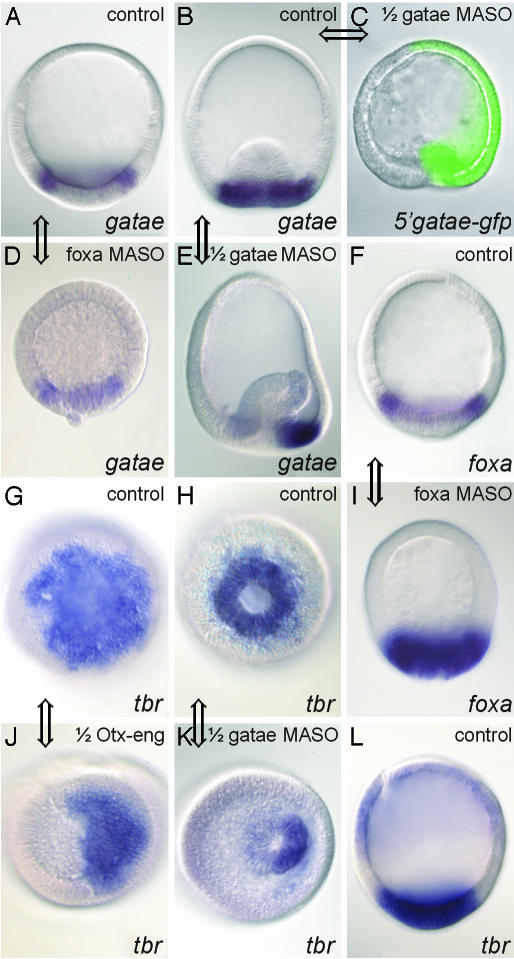
Fig. 6.
Visualization of regulatory interactions in perturbed A. miniata embryos by using WMISH. Views are lateral (A-F, I, and L) or from vegetal pole (G, H, J, and K). Embryos (except C) are stained after WMISH to reveal the localization of the transcript indicated at the bottom on the right. Zygotes were injected with 600 μM αfoxa MASO (D and I), or one of the first two blastomeres was injected with 1 mM αgatae MASO (C, E, and K), or 0.4 pg/pl otx-eng mRNA (J), as indicated at the top on the right. (A and B) Control gatae WMISH patterns: A, normal blastula; B, normal gastrula. (C) Blastula grown from a zygote injected with an mRNA of an in-frame fusion corresponding to the 5′ gatae sequence (containing the gatae MASO target site) with GFP, followed by an injection of 1 mM αgatae MASO into one blastomere at the two-cell stage. The loss of GFP expression from the half-embryo that results from this injected blastomere demonstrates that the αgatae MASO effectively binds to its target sequence and blocks translation in vivo. Gastrulation fails to initiate in this half-embryo. Zygotes injected with both this mRNA fusion and 1 mM control (random sequence) MASO expressed GFP throughout (data not shown). (D) Effect of blocking Foxa translation on gatae expression at blastula stage (compare A). (E) Effect of blocking Gatae translation on expression of gatae gene at gastrula stage (compare left and right halves). (F) Normal foxa expression at blastula stage. (G and H) Normal tbr expression viewed from vegetal pole of blastula (G) or gastrula (H). (I) Effect of αfoxa MASO on foxa RNA expression at blastula stage (compare with F). (J) Effect of Otx-Eng fusion on tbr expression at blastula stage (compare with G). (K) Effect of αgatae MASO on tbr expression at gastrula stage (compare with H). (L) Normal tbr expression in gastrula, viewed laterally. Double-headed arrows connect the relevant control embryos provided for comparison with its perturbed partner; each such comparison confirms a regulatory connection, which was inferred from the QPCR data summarized in Figs. 2 and 5.

