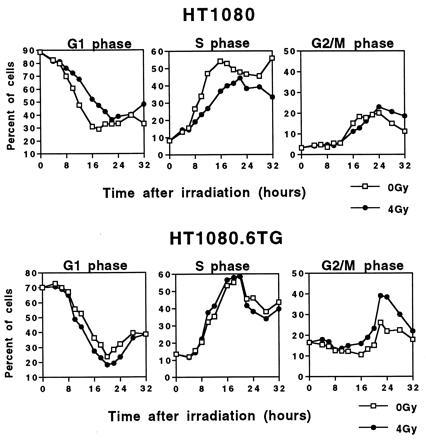
Figure 2.

Cell cycle progression of synchronized cells irradiated in early G1 with 4 Gy of γ-radiation. (Upper) The percentage of control (0 Gy) or irradiated (4 Gy) synchronized HT1080 cells in the various phases of the cell cycle as a function of time after irradiation. (Lower) The percentage obtained for control (0 Gy) or irradiated (4 Gy) synchronized HT1080.6TG cells as a function of time.
