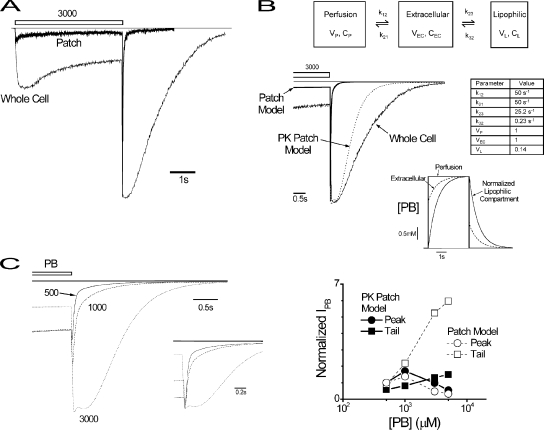
Figure 7.
Inclusion of three compartment PKs to patch model reproduces divergent features of rapidly perfused whole cells. (A) Plot of representative responses triggered by the application of 3,000 μM (open bar) obtained in whole cell and macropatch experiments as indicated. (B, top) PK model with three compartments representing perfusion solution (Perfusion), extracellular membrane solution (Extracellular), and a proposed third that is lipophilic (Lipophilic). The extracellular compartment contains GABARs and includes the unstirred layer (Maconochie and Knight, 1989). PB molecule movement between compartments is shown by single-headed arrows with the indicated rate constants. Model parameter values are given in the table, and values were obtained based solely on rapid whole cell wash-in kinetics, PB octanol-water partition coefficient, and whole cell onset kinetics (Fig. 2; see Results). (Bottom) 3,000-μM whole cell and patch model current responses from A and Fig. 6 B, respectively, on an expanded timescale to show current time courses before and after washout as indicated. The response of the PK patch model (combination of PK submodel and patch models) provides for reproduction (dashed line) of the whole cell response. (Inset) Simulated time course of compartmental PB concentrations of PK patch model for the displayed response. The concentration of the lipophilic compartment was normalized to that of the perfusion compartment for comparison of the nature of time course. (C, left) Family of simulated tail currents from PK patch model at the indicated concentrations. The straight line marks the baseline. (Right) Concentration–response relationships for patch and PK patch models for current peak, plateau, and tail amplitudes, and whole cell data in the form of Fig. 1 B (see Results).

