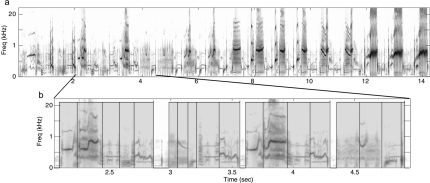
Figure 1.
Hierarchical organization of starling song. Spectrograms showing spectral power as a function of time for (a) a 14-s long excerpt from a much longer bout of singing by one male European starling and (b) a region from the same song with the temporal axis expanded. Motifs in (b) are denoted by the gray shading, and the boundaries of submotif features (see Sec. 2) are shown by the overlaid black boxes. Note the highly variable but still repetitive structure, and the hierarchy of groupings for spectrotemporal acoustic patterns.

