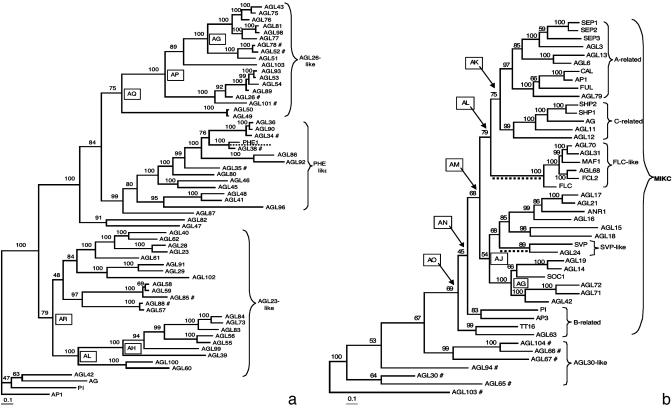
Fig. 2.
Type I and type II A. thaliana MADS-box Bayesian phylogenies. (a) Type I tree polarized with type II sequences. (b) Type II tree polarized with type I sequences. Numbers above or below branches represent posterior probabilities. Branch lengths are proportional to the number of nucleotide substitutions. Boxed letters identify clades in which site-specific tests of positive selection yielded statistically significant LRT results for at least two model comparisons and in which at least one of the models detected sites under PDS with PP > 0.90. Branches underlined with a broken line identify cases in which the branch-site analyses yielded significant PDS results. #, Excluded from the site-specific analyses.

