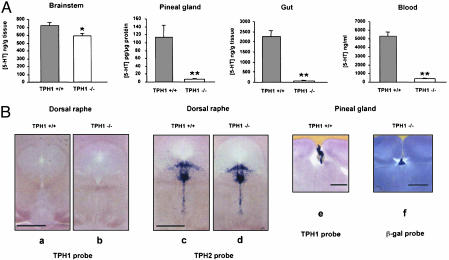
Fig. 2.
Tissue-specific expression of tph1 and tph2.(A) 5-HT levels in tph1-/- and tph1+/+ mice in the brainstem (tph1-/-, n = 11, and tph1+/+, n = 8), the pineal gland (tph1-/-, n = 17, and tph1+/+, n = 8), the gut (tph1-/-, n = 10, and tph1+/+, n = 4), and the blood (tph1-/-, n = 7, and tph1+/+, n = 7). Values are expressed as mean ± SEM; *, P < 0.05; **, P < 0.001 (Student t test) for the difference between tph1-/- and tph1+/+ mice. (B) TPH1 and TPH2 mRNAs as revealed by ISH. The TPH1 riboprobe was used in Ba, Bb, and Be; the TPH2 riboprobe was used in Bc and Bd. The β-GAL riboprobe was used in Bf. (Scale bars = 1 mm.)

