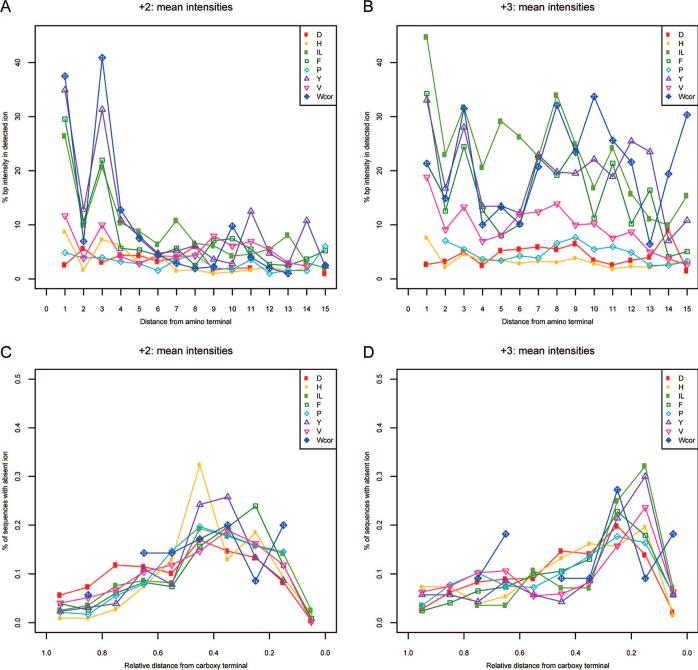
Figure 5.
Relationship of base-peak-normalized immonium ion intensity to the position of the associated amino acid in the assigned peptide sequence. Average normalized immonium ion intensity for each residue is plotted against the absolute position of the residue in the assigned sequence for doubly-charged (A) and triply-charged spectra (B). The fraction of the population of all spectra that contain the associated residue but fail to produce the expected immonium ion peak plotted against relative position in the assigned sequence for doubly-charged (C) and triply-charged spectra (D).

