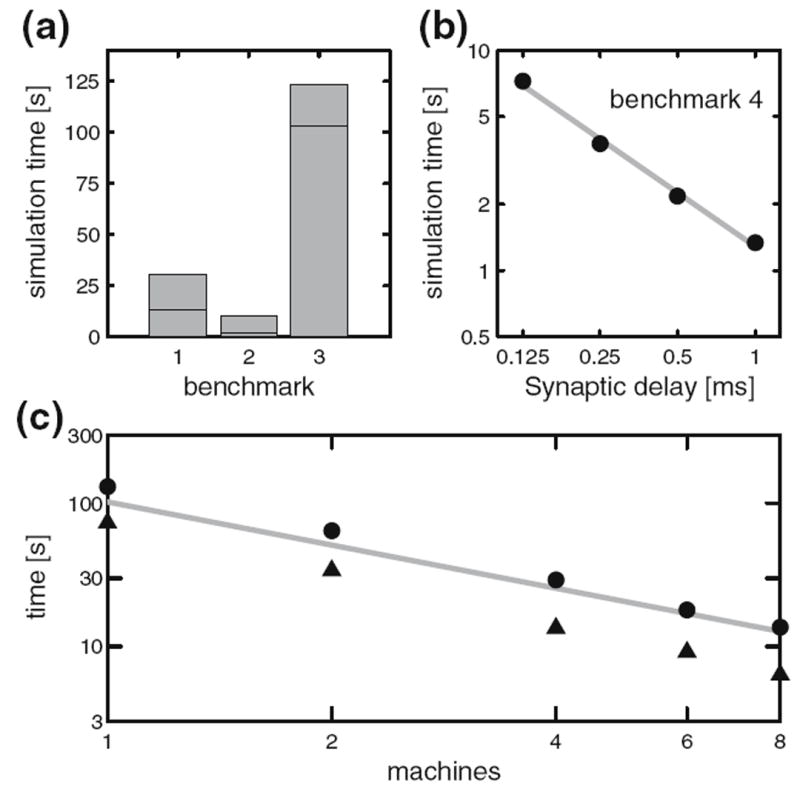
Fig. 10.

Performance of NEST on Benchmarks 1-4 and an additional benchmark (5) with STDP. (a) Simulation time for one biological second of Benchmarks 1-3 distributed over two processors, spiking supressed, with a synaptic delay of 0.1 ms. The horizontal lines indicate the simulation times for the benchmarks with the synaptic delay increased to 1.5 ms. (b) Simulation time for one biological second of Benchmark 4 as a function of the minimum synaptic delay in double logarithmic representation. The gray line indicates a linear fit to the data (slope–0.8). (c) Simulation time for one biological second of Benchmark 5, a network of 11250 neurons and connection probability of 0.1 (total number of synapses: 12.7 × 10⁶) as a function of the number of processors in double logarithmic representation. All synapses static, triangles; excitatory-excitatory synapses implementing multiplicative STDP with an all-to-all spike pairing scheme, circles. The gray line indicates a linear speed-up
