
Fig. 18.
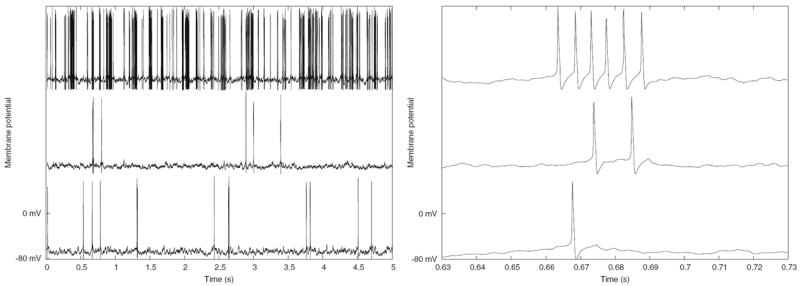
Plots of the membrane potential for 3 of the 4000 cells. The right plot shows a subset of the data in the left plot, with higher time resolution (SPLIT simulation of Benchmark 3)
Official websites use .gov
A
.gov website belongs to an official
government organization in the United States.
Secure .gov websites use HTTPS
A lock (
) or https:// means you've safely
connected to the .gov website. Share sensitive
information only on official, secure websites.
Plots of the membrane potential for 3 of the 4000 cells. The right plot shows a subset of the data in the left plot, with higher time resolution (SPLIT simulation of Benchmark 3)