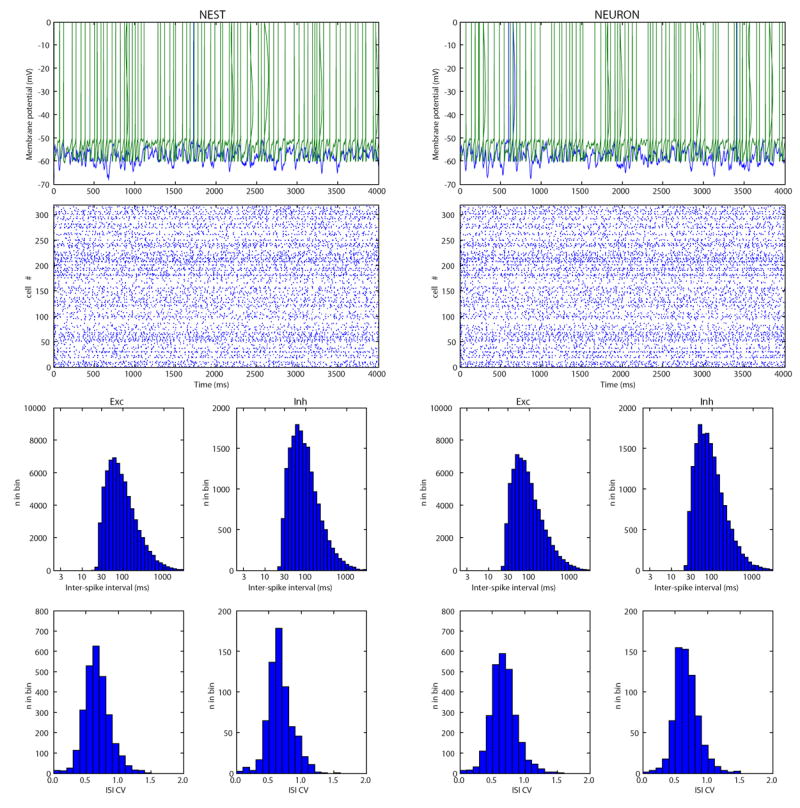
Fig. 24.

Same network model run on two different simulators using the same source code. The model considered was the Vogels-Abbott integrate-and-fire network with CUBA synapses and displaying self-sustained irregular activity states (Benchmark 2 in Appendix B). This network implemented with the PyNN simulator-independent network modelling API, and simulated using NEST (left column) and NEURON (right column) as the simulation engines. The same sequence of random numbers was used for each simulator, so the connectivity patterns were rigorously identical. The membrane potential trajectories of individual neurons simulated in different simulators rapidly diverge, as small numerical differences are rapidly amplified by the large degree of recurrency of the circuit, but the interspike interval (ISI) statistics of the populations are almost identical for the two simulators. (Top row) Voltage traces for two cells chosen at random from the population. (Second row) Spike raster plots for the first 320 neurons in the population. (Third row) Histograms of ISIs for the excitatory and inhibitory cell populations. (Bottom row) Histograms of the coefficient of variation (CV) of the ISIs
