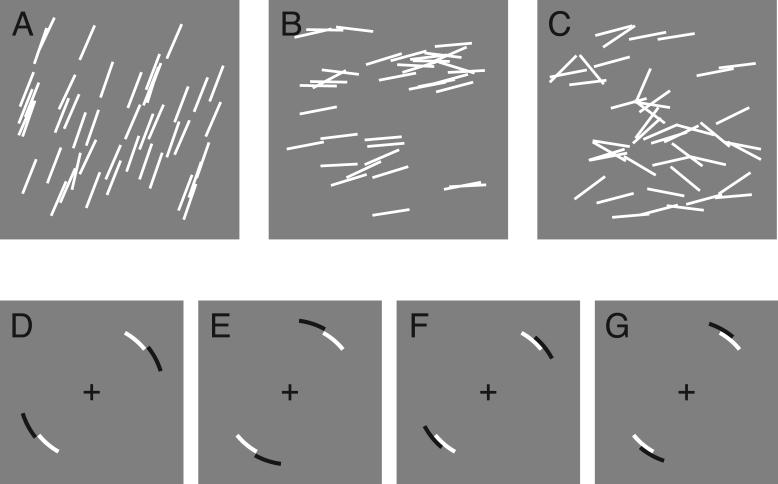
Figure 1.
Example stimuli and the four payoff displays. The top row contains example stimuli with sl = .002 (A), .02 (B) and .2 (C). After a brief display of the stimulus, subjects were shown one of four possible payoff display in which the black, penalty region was either far from the white reward region (D-E) or near (F-G).

