
Figure 5.
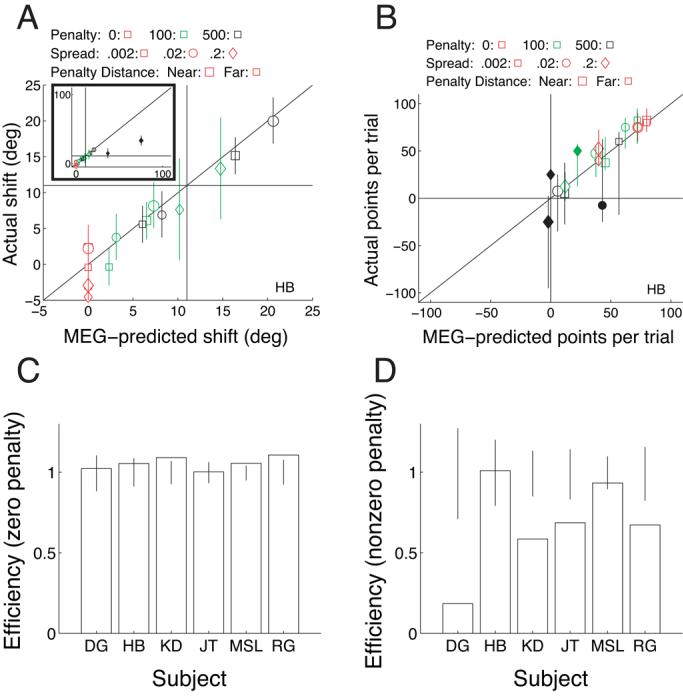
Results of Experiment 2. All plotting conventions as in Figure 4. (A) Setting shifts. (B) Performance in points per trial. (C) Efficiency in the two zero-penalty conditions. (D) Efficiency in the four nonzero-penalty conditions. Individual data for the other subjects are shown in Supplementary Figure A2.