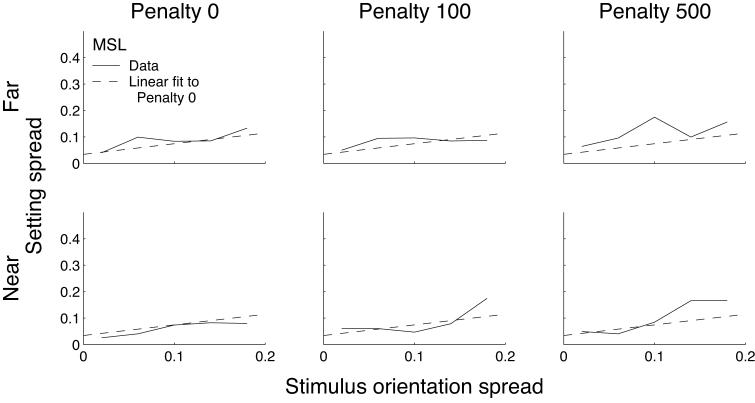
Figure 7.
Setting spreads in Experiment 3 for subject MSL. Setting spreads are plotted as a function of stimulus orientation spread for the six conditions, computed using bins of width 0.4. Dashed lines show a linear fit to the data pooled over the two zero-penalty conditions. Data for the other subjects are shown in Supplementary Figure A4.

