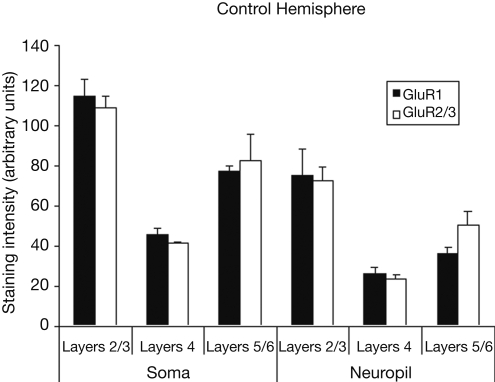
Figure 2.
Average staining intensity for GluR1 and GluR2/3 AMPA receptor subunits in the median nerve area of the control hemispheres. Data are grouped by layer(s) (2/3, 4, and 5/6), and by whether the intensity measurements were taken from cell bodies or from neuropil. Staining intensities for GluR1 and GluR2/3 are higher for measurements taken from cell bodies than for measurements taken from neuropil. For both GluR1 and GluR2/3 staining intensities are highest in upper layers of cortex, with weaker staining in layer 4, and more moderate staining throughout layer 5/6.

