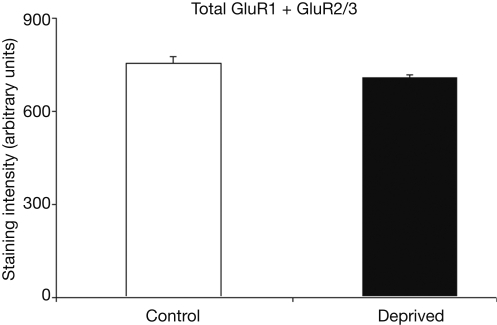
Figure 5.
Average total staining intensities for GluR1 and GluR2/3 in control and deprived hemispheres are comparable. This Figure illustrates that while there are subunit differences in the deprived hemisphere, the summation of these measures indicates a relatively stable total level of combined GluR1 and GluR2/3 expression throughout control and deprived cortex.

