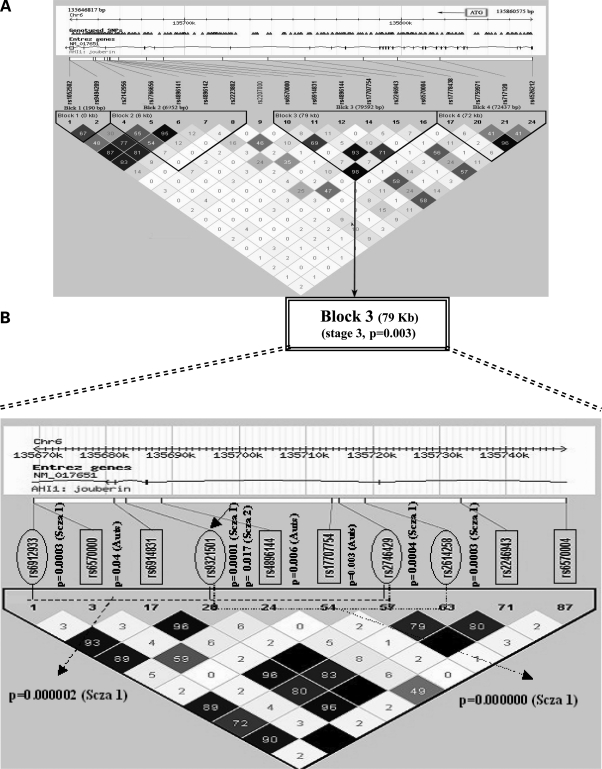
Figure 1.
Fine-scale depiction of the AHI1 ASD-associated haplotype. The genomic region is shown on top, followed by an exon–intron map and NCBI genome release 35 SNP location. Shown below is an LD plot of the region based on r2 (see Materials and Methods). SNPs genotyped in the autism sample in this study are boxed, whereas those genotyped in the published schizophrenia associations (34,45) are circled. The single SNP P-values are shown adjacent to each SNP. Schizophrenia SNPs are marked ‘Scza 1’ or ‘Scza 2’ depending on whether they were typed in the Arab-Israeli (34) or in the Icelandic population (45). Associated SNPs in our study are marked as ‘Auts’. The two schizophrenia haplotypes in the Arab-Israeli study are depicted with discontinuous lines. One can see the ∼30 kb area of overlap of these two haplotypes in the center of this region, which occurs in a region of strong LD within the gene. The region also harbors the two most highly associated SNPs in our current autism study (rs4896144 and rs17707754), which are in the center of this block of low LD.

