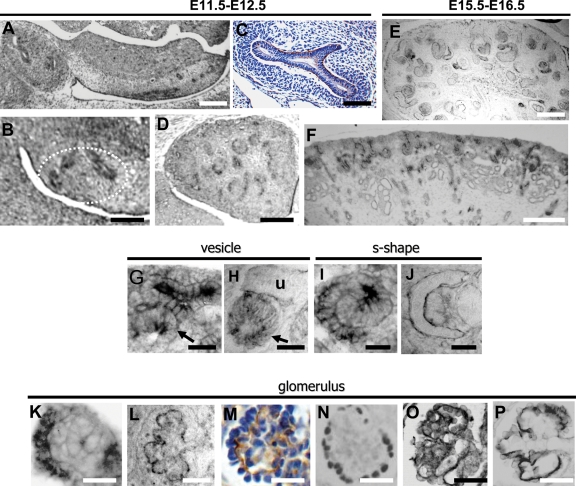
Figure 1.
Fras1 expression in wild-type metanephroi. (A), (B), (D), (F), (G), (I) and (K) are of ISH, and (C), (E), (H), (J) and (L–P) are of IHC. Sections in (C) and (M) were counterstained with haematoxylin. (A) Fras1 transcripts (black) in the E11 UB stalk and branches within the metanephros (oval in left of frame). Fras1 was also expressed in the MD and in mesonephric tubules (mesonephros/gonadal ridge is the elongated structure in the centre and right of frame). (B) Higher power of an E11 metanephros: ISH Fras1 signal in UB branches (outlined by white dashes). (C) Fras1 protein was detected as a fine (brown) line on basal surfaces of E11 UB stalk and branches (note the lack of positive signal in cell layers of surrounding MM). (D), (E) and (F) Respective low-power views of Fras1 ISH at E12, IHC at E15 and ISH at E16. Note Fras1 expression (black) in diverse epithelial structures. (G) and (H) High-power views of E16 nephrogenic cortex showing Fras1 transcripts in UB branches and adjacent vesicle [arrowed in (G)], with Fras1 immunolocalized in a linear pattern around the UB branches [u in (H)] and in a cytoplasmic pattern in a nephron vesicle [arrow in (H)]. (I) and (J) High-power views of E16 deeper cortex showing an S-shaped body, with the proximal limb to the left and distal limb to the right. Fras1 transcripts [black in (I)] were detected in both limbs with protein detected in a linear pattern on glomerular epithelia (J): the left-hand crescent is Fras1 on the basal aspect of parietal epithelia, whereas the inner crescent is the basal aspect of immature, columnar podocytes. (K)–(P) Capillary loop-stage glomeruli in E16 metanephros. (K) Fras1 transcripts (black) in glomerular epithelia. (L) and (M) Fras1 immunolocalized [black in (L) and brown in (M)] in a wavy, linear pattern at the basal aspect of podocytes. (N), (O) and (P) Frames, respectively, show ICH for Wt1, podocin and Itga3, with positive signals in black. Note the similarity of the Fras1 ICH pattern to that of Itga3, and to a lesser extent, podocin. Bars in (A), (D), (E) and (F) are 200 µm; bars in (B) and (C) are 100 µm; bars in (G)–(P) are 25 µm.

