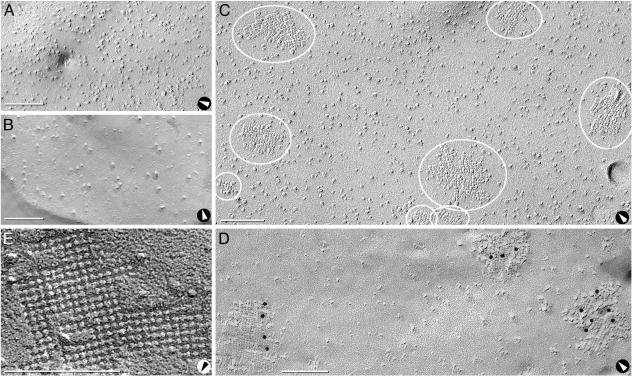
Fig. 3.
Freeze-fractured control CHO cells and cells expressing M23. (A and B) P-face (A) and E-face (B) images of cells transfected with empty vector reveal P-face IMPs and E-face pits of 7- to 9-nm diameter but no square arrays. No 4- to 6-nm-diameter pits were detected. E-faces have fewer IMPs than P-faces (A). (C) P-face image of M23 cell reveals three square arrays (small ovals) and five large rafts, all with 6-nm spacing (large ovals). (D) Anti-CT immunogold labeling of rafts in P-face of M23 cell. (E) High magnification of E-face image of raft in M23 cell. D was from formaldehyde-fixed cells (24), but the other images were from glutaraldehyde-fixed cells. Arrows denote direction of shadowing. (Bars = 100 nm.)

