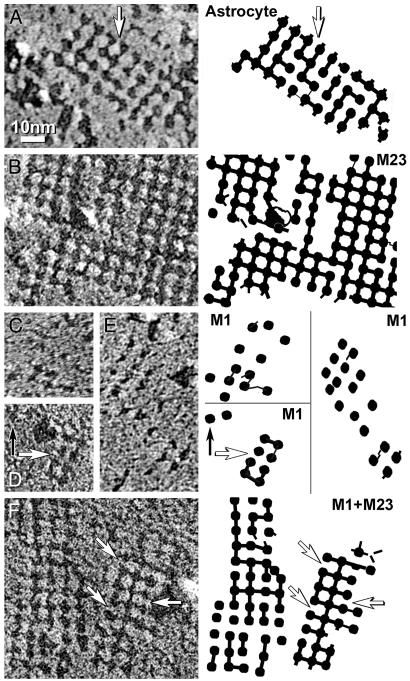
Fig. 7.
High-magnification E-face images and companion diagrams illustrating 2-nm furrows linking adjacent pits. (A) Astrocyte square arrays with missing furrows (arrow). (B) M23 raft has furrows connecting >90% of pits. (C-E) Incipient arrays in M1 cells have fewer furrows and irregular lattice spacings, ranging from 5 nm to 11 nm. (F) Square array in M1+M23 cell has furrows linking ≈50% of pits. All shadows are from right to left. Companion diagrams denote positions of pits and furrows. Arrows indicate missing furrows. B-E are shadowed at similar local declination angles and at ≈45° azimuth to the orthogonal lattices; each was selected for identical platinum granularity and image resolution. The effects of shadow angle and azimuth on ability to resolve cross-bridges have been described (23). (≈×450,000.)

