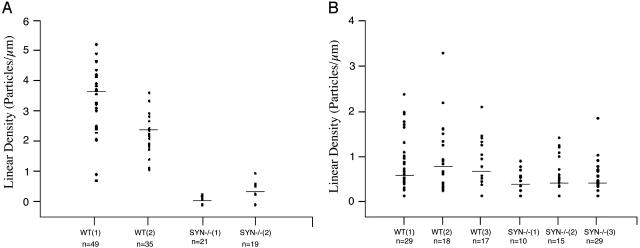
Fig. 2.
Scatter plots showing the linear densities of immunogold labeling of AQP4 and Kir4.1 in perivascular astrocyte end-feet of hippocampus. (A) AQP4 labeling densities of preparations from two WT mice and two Syn-/- mice are visibly different (P < 0.001 for each animal by post hoc Scheffé test). (B) Kir4.1 labeling densities of preparations from three WT and three Syn-/- mice overlap with no statistically significant differences (P = 0.4-0.8). Each dot (y axis) represents the linear density of gold particles around a single capillary (n noted below x axis) in preparations from WT or Syn-/- mice; horizontal bars represent median values.

