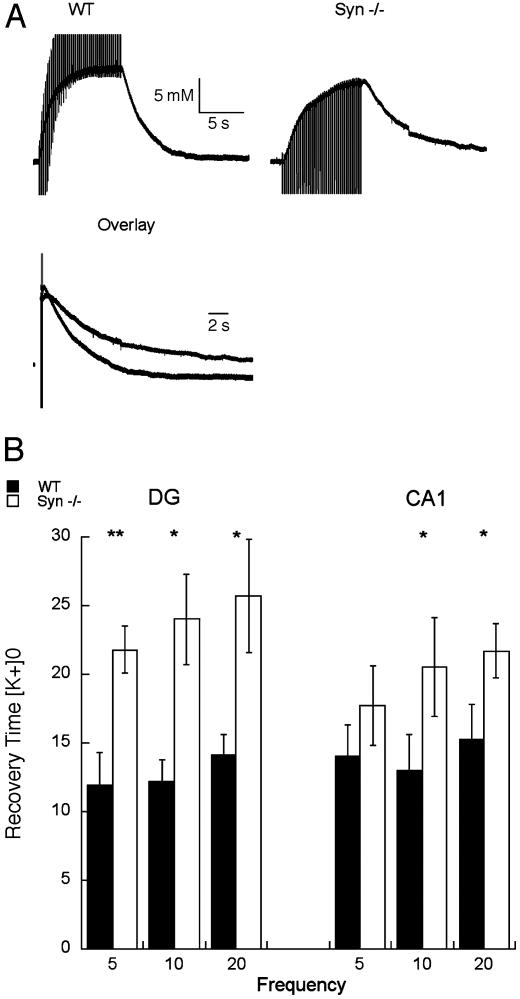
Fig. 4.
Prolongation of the recovery of [K+]o after repetitive orthodromic stimulation of isolated hippocampal slices. (A) Representative tracings of [K+]o signal during and after a 10-Hz train delivered to the Schaffer collaterals from WT and α-Syn-/- mice shown separately or superimposed in overlay. (B) Pooled data from measurements taken from five WT mice and six α-Syn-/- mice. Plots represent time, in seconds, elapsed during recovery from 90% of peak value to the 10% level in CA1 and the dentate gyrus (DG). Data are shown as mean ± SEM. *, P < 0.05; **, P < 0.001.

