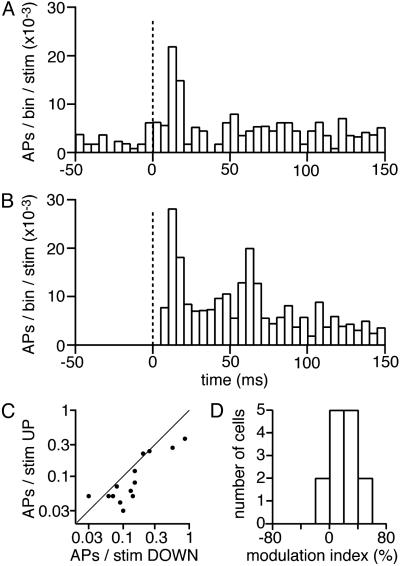
Fig. 5.
Sensory-evoked APs are suppressed in UP state. (A) The averaged peristimulus time histogram (PSTH, stimulus at 0 ms; 14 neurons) of action potentials in layer 2/3 (bin width 5 ms) computed for stimuli delivered during the UP state. (B) The averaged peristimulus time histograms computed for stimuli delivered during the DOWN state. Note that there was no background activity before the stimulus (from -50 ms to 0 ms) in the DOWN state, whereas significant background activity was found in the UP state. However, neurons responded more vigorously to whisker deflection during DOWN state than UP state. (C) The number of action potentials evoked per stimulus in the first 150 ms was quantified separately for UP and DOWN states of each neuron. The x axis (log scale) shows the DOWN state response, and the y axis (log scale) shows the UP state response of individual neurons (each dot corresponds to a neuron). Individual neurons fire either a similar number of action potentials in UP or DOWN states or a reduced number of action potentials from the UP state. (D) The modulation of sensory response by UP and DOWN states was characterized by computing a modulation index, defined as 100 × (DOWN response - UP response)/(UP response + DOWN response), where response is the number of spikes fired by a neuron within 150 ms after the stimulus. Again, by this measure the sensory-evoked action potential firing activity was either unchanged or reduced during the UP state (modulation index, 20 ± 5%; n = 14 cells).

