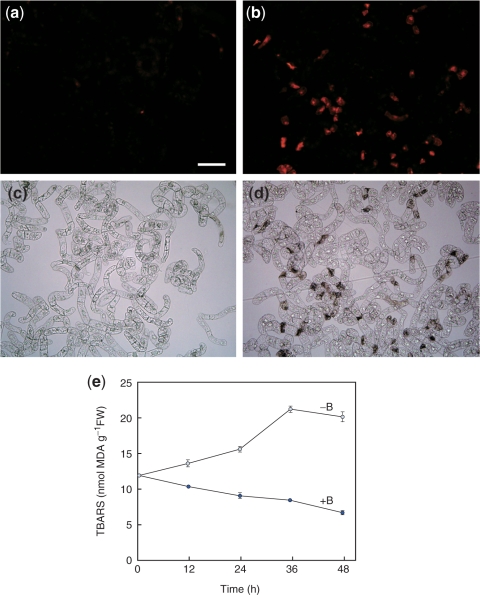
Fig. 2.
Oxidative stress induced by B deprivation. (a–d) Accumulation of ROS. At 12 h after treatment, +B (a, c) or −B (b, d) cells were stained with DHE and observed under fluorescence (a, b) or bright-field (c, d) microscopy. Bar = 100 μm. (e) Accumulation of lipid peroxides. Lipid peroxides were quantified by the TBARS method and expressed as nmol malondialdehyde (MDA) per gram fresh weight. Each value is the mean of two replicates and the error bar represents the difference between the replicates.

