Fig. 1.
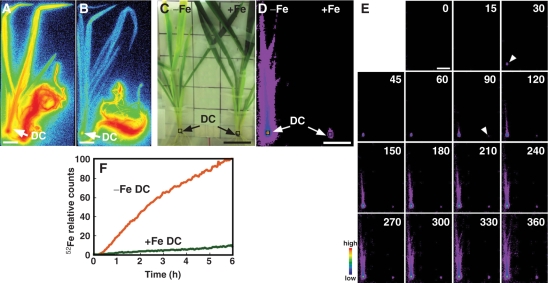
52Fe translocation from roots to shoots in Fe-deficient (−Fe) and Fe-sufficient (+Fe) barley (Experiment 1). (A and B) Images of 52Fe translocation in Fe-deficient (A) and Fe-sufficient (B) barley using BAS-1500. (C) Gross image of Fe-deficient (left) and Fe-sufficient (right) barley analyzed using PETIS. The same frame was used for D and E. (D) PETIS images of 52Fe accumulation after 6 h. (E) Time course of radioactivity accumulation analyzed using PETIS. The images are shown at 15 and 30 min intervals (0–60 and 60–360 min, respectively). Data were scored every 3 min. Arrowheads indicate the first detection of DC (left arrowhead −Fe, right arrowhead +Fe). (F) Time course of radioactivity accumulation in the DC of Fe-deficient and Fe-sufficient barley (squares in C and D). The maximum measured radioactivity was defined as 100. Activities are shown as percentages of the maximum value. Scale bar = 4 cm. Experiments 2 and 3 are shown in Supplementary Figs. S1 and S2, respectively.

