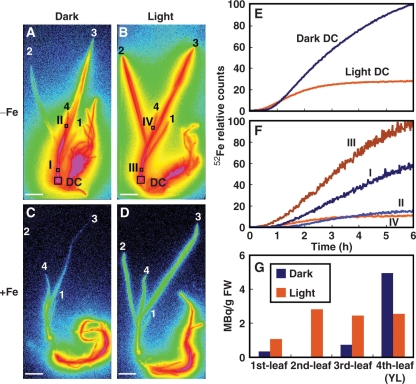
Fig. 2.
52Fe translocation in Fe-deficient (−Fe) and Fe-sufficient (+Fe) barley in the dark and in the light (Experiment 1). (A–D) Images of 52Fe translocation in Fe-deficient (A, B) and Fe-sufficient (C, D) barley in the dark (A, C) and in the light (B, D) using BAS-1500. Leaf numbering: 4, youngest leaf (YL); 3, third leaf; 2, second leaf; 1, first leaf. (E and F) Time course of 52Fe translocation in the DC (E) and at the points indicated in A and B (F) of Fe-deficient barley measured by PMPS and PETIS, respectively. The maximum measured radioactivity in PMPS and PETIS was defined as 100. Activities are shown as percentages of the maximum value. (G) 52Fe content in the leaves of Fe-deficient barley after 6 h.

