Fig. 4.
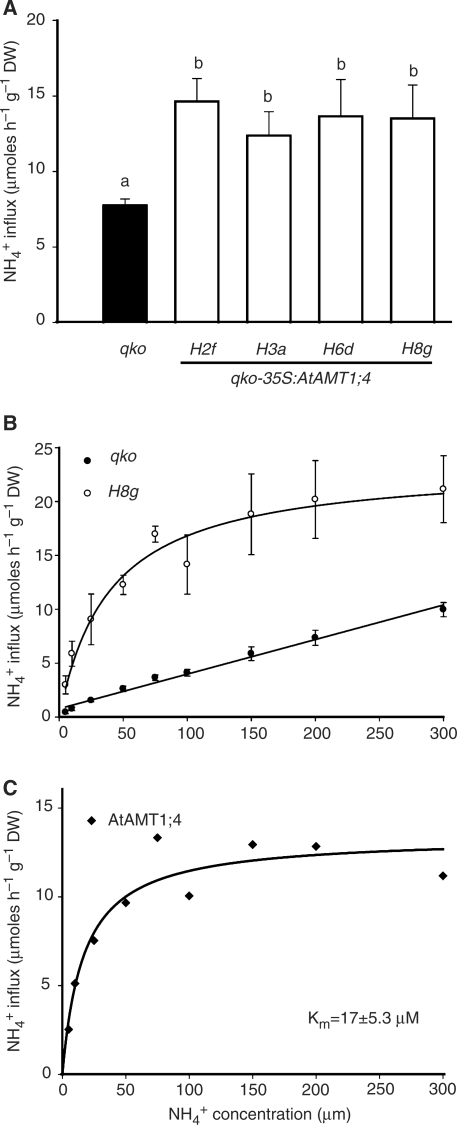
Increased high-affinity ammonium uptake capacity in qko-35S:AtAMT1;4 transgenic plants. (A) Influx of 15N-labeled ammonium into roots of qko and transgenic qko-35S:AtAMT1;4 lines (H2f, H3a, H6d and H8g). 15N-labeled ammonium was supplied at 200 μ M. Bars indicate means ± SD, n = 8–10 plants, and significant differences at P < 0.001 are indicated by different letters. (B) Concentration-dependent influx of 15N-labeled ammonium into roots of qko and the transgenic qko-35S:AtAMT1;4 line H8g. Symbols indicate means ± SD, n = 5–6 plants. (C) 15N-labeled ammonium influx mediated by AtAMT1;4 was calculated by subtracting the value of qko from H8g in (B). Curves were directly fitted to the data for H8g in (B) and those in (C) using the Michaelis–Menten equation. A linear curve was used to fit the data for qko in (B).The caclulated Km value for AtAMT1;4 was 17 ± 5.3 μ M. All plants were cultured hydroponically under continuous supply of 2 mM ammonium nitrate for 6 weeks.

