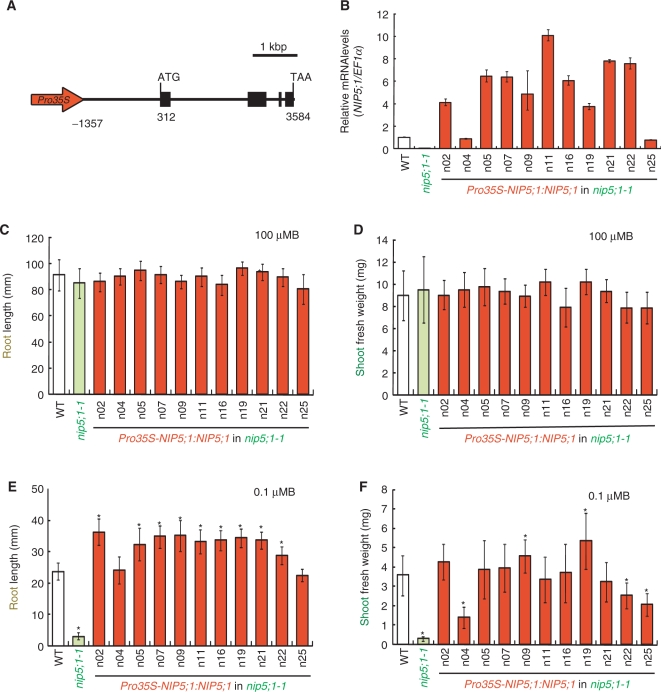
Fig. 2.
Generation and growth characterization of Pro35S-NIP5;1:NIP5;1 transgenic plants in the nip5;1-1 background. (A) The schematic representation of the DNA construct which has the CaMV 35S promoter at 1,357 bp upstream of the NIP5;1 transcription initiation site. (B) Relative mRNA level of NIP5;1 in roots of the transgenic plants. Plants were grown on plates containing 100 μM B for 12 d. Then the plants were transferred to plates containing 0.1 μM B and incubated for 1 d. Total RNAs were extracted from roots of 7–10 plants. The averages and SDs are presented for independent reverse transcription reactions followed by real-time PCR (n = 3). (C–F) Growth of the transgenic plants. Plants were grown on solid medium containing 100 or 0.1 μM boric acid for 12 d. Shoot fresh weights and primary root lengths were measured. Averages and SDs are shown (n = 9–10). Asterisks indicate significant differences from the wild-type plants (Student's t-test P < 0.05). (C) Primary root length under 100 μM B conditions. (D) Shoot fresh weight under 100 μM B conditions. (E) Primary root length under 0.1 μM B conditions. (F) Shoot fresh weight under 0.1 μM B conditions.

