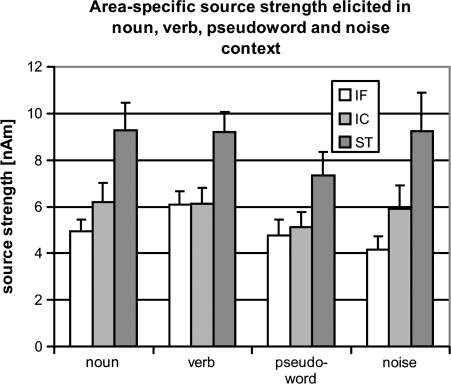
Figure 6.
Maximal source strengths elicited in the superior–temporal, inferior–central and inferior–frontal ROIs in the left hemisphere. Averages over all participants (bars) and standard errors (lines) of ROI-specific activation are shown. ST - superior-temporal, IC - inferior-central, IF - inferior-frontal.

