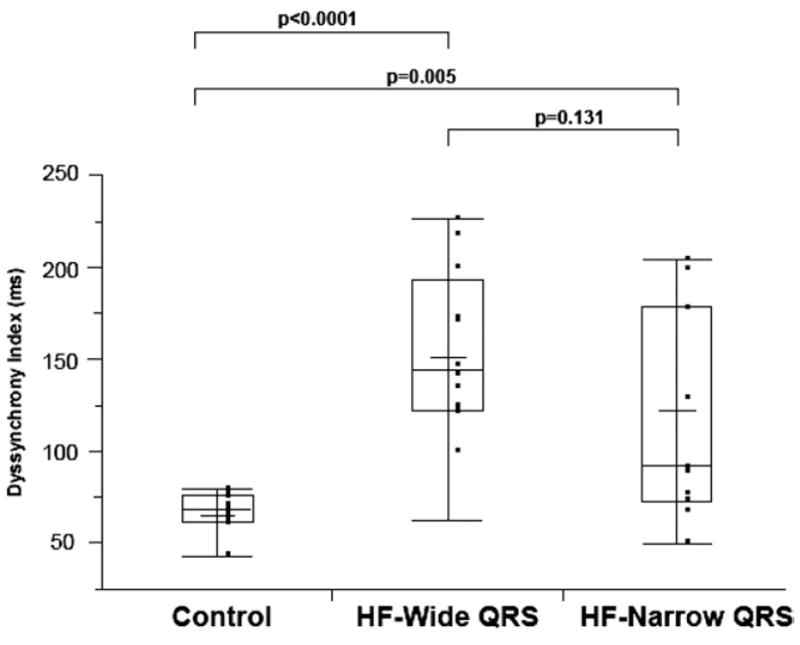
Figure 3. Box and Whisker Plot of DI Using Changes in LV Wall Thickness of the 3 Groups.

Mean DI was significantly different between the 3 groups and was greatest in the HF-wide QRS group, followed by the HF-narrow QRS, and then the control group (152 ± 44 ms vs. 121 ± 58 ms vs. 65 ± 12 ms, respectively; p < 0.0001). HF = heart failure; LV = left ventricular; other abbreviations, as in Figure 2.
