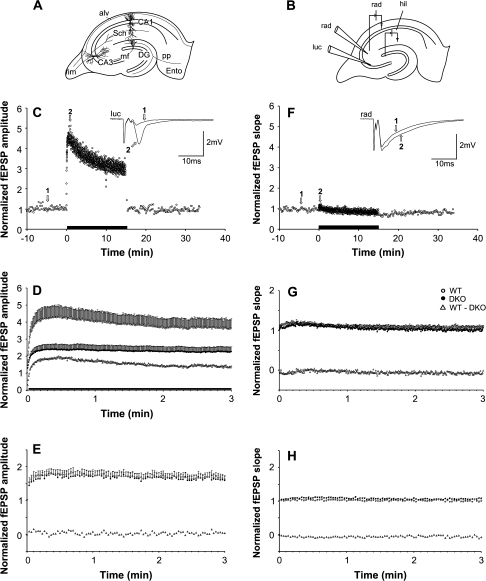
Figure 5.
Frequency facilitation in the MF–CA3 and AC collateral–CA3 pathways. (A) Schematic drawing of the hippocampal slice with a simplified relevant excitatory network. Ento, entorhinal cortex; DG, dentate gyrus, pp, perforant path; fim, fimbria; alv, alveus; Sch, Schaffer collaterals (branches of AC collateral axons). (B) Schematic drawing showing electrode arrangement in the CA3 region. One recording electrode was placed extracellularly in stratum lucidum (luc), the other in stratum radiatum (rad) in order to monitor synaptic responses elicited by stimulation electrodes placed in the hilus (hil) and in the stratum radiatum for selective stimulation of MFs and AC collaterals, respectively. (C) Normalized fEPSP amplitude measurements during afferent stimulation of the MF in an experiment at 0.1 Hz in WT mice, followed by 2 Hz for 15 min (indicated by black bar along the abscissa), and reversal to 0.1 Hz. Inset shows the mean of 5 consecutive responses at times indicated by open arrows and numbers. (D) Normalized and pooled MF-elicited fEPSPs in WT (open circles) and synapsin DKO (filled circles) mice following the switch from 0.1- to 2-Hz stimulation (only the first 3 min are shown). Subtraction of the values obtained in synapsin DKO mice from those obtained in WT mice is represented by the open triangles. Vertical bars indicate standard error of the mean. Black horizontal bar along the abscissa indicates that the genotypes differ (P < 0.05). (E) As in (D), but following the switch from 0.1- to 0.5-Hz stimulation of the MF–CA3 pathway. (F) as in (C) and (G) and (H) as in (D) and (E), but measurements are from responses elicited by stimulation of the AC collateral–CA3 pathway.

