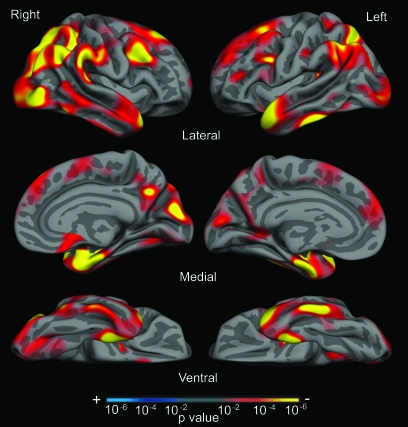
Figure 2.
The cortical signature of AD: map of cortical thinning across the hemispheres in AD. An exploratory analysis was conducted across the entire cortical surface to identify regional thinning in AD in Sample 1a. Surface maps of cortical thinning were generated by assessing the influence of AD on thickness (using the general linear model) at each vertex across the entire cortical mantle. Maps are presented on the semi-inflated cortical surface of an average brain with dark gray regions representing sulci and light gray regions representing gyri. Non-neocortical regions and regions that are not part of the cortical mantle (such as the corpus callosum and thalamus) have been excluded from the analysis. The color scale at the bottom represents the significance of the thickness difference with yellow indicating regions of most significant thinning in AD compared with OC. See Table 2 for quantitative metrics of the amount of thinning in each region.

