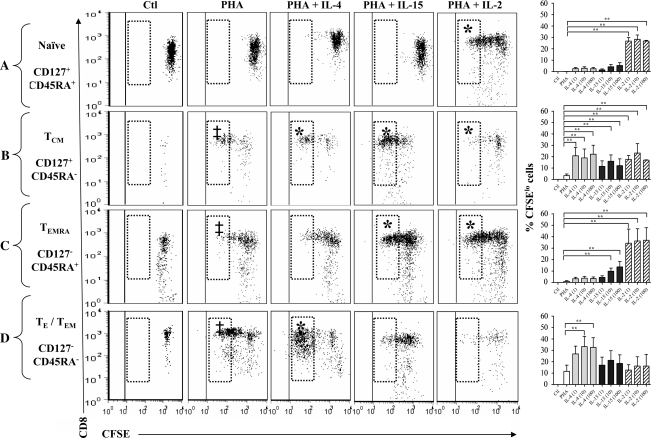
Fig. 3.
Cell division of subsets of CD8+CD127+ and CD8+CD127− T cells. Isolated CD8+CD127+ and CD8+CD127− T cells were cultured with media only (Ctl) and cells incubated with PHA (2.5 μg ml−1), PHA + IL-4 (1, 10 or 100 ng ml−1) or PHA + IL-15 (10 ng ml−1) or PHA + IL-2 (1, 10 or 100 units ml−1). Representative dot plots (y-axis, CD8+: x-axis, CFSE) of cell division profiles of CD8+ T cell subsets are shown: (A) CD127+CD45RA+, (B) CD127+CD45RA−, (C) CD127−CD45RA+ and (D) CD127−CD45RA−. The CFSElo cells (shown in hatched boxes) have undergone the maximum number of detectable divisions. The cytokine concentrations shown here include IL-4 (100 ng ml−1), IL-15 (10 ng ml−1) and IL-2 (100 units ml−1). In addition, the proportion of CFSElo cells from experiments in six individuals is summarized in bar graphs. Statistically significant changes in the proportion of CFSElo cells are indicated with a ‘‡’ compared with unstimulated controls (Ctl) or ‘*’ when comparing PHA + IL-4 (paired Student's t-test, P < 0.05), IL-15 or IL-2 to PHA alone.

