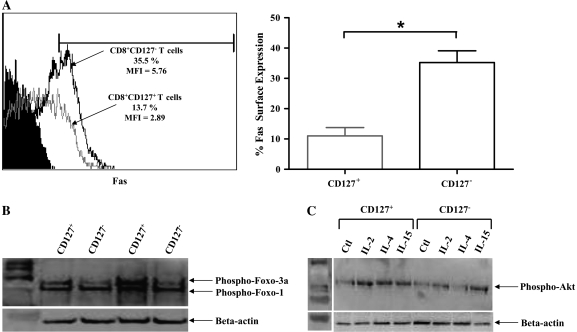
Fig. 7.
Expression of Fas on CD8+CD127− T cells and CD8+CD127+ T cells. (A) A representative figure of Fas expression on freshly isolated CD8+CD127+ (gray line) and CD8+CD127− T cells (black line) as evaluated by flow cytometry. Unstained cells are shown in black fill. The expression of Fas is graphed as % Fas-positive cells within isolated CD8+CD127+ and CD8+CD127− T cells. Statistical significance is denoted by ‘*’ as calculated by analysis of variance analysis (P < 0.05, n = 7). (B) The baseline expression of phosphorylated FOXO3a by CD8+CD127+ and CD8+CD127− T cells is shown by western blot analysis, depicting the results of two individuals as representatives of six individuals tested. The expression of FOXO1 was also detected by the FOXO-specific antibody. The expression of beta-actin was used as a loading control. (C) The expression of phosphorylated-Akt CD8+CD127+ and CD8+CD127− T cells cultured for 2 h with medium, IL-2 (100 units ml−1), IL-4 (100 ng ml−1) or IL-15 (100 ng ml−1) is shown by western blot. The data represent the results of one individual as a representative of four individuals tested.

