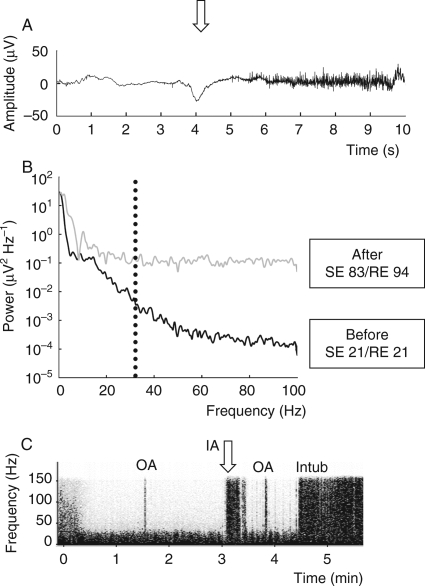
Fig 2.
(a) The appearance of EMG activity in EEG signal after laryngoscopy (arrow downward) and attempted intubation in a patient not receiving remifentanil. EEG signal remains suppressed, despite strong EMG contamination. (b) Power spectrum of the EEG signal before (black line) and after (grey line) laryngoscopy in the same situation as in (a). EMG activity changes the spectrum after laryngoscopy. The spectrum with EMG impact starts to change already below 20 Hz. Dotted vertical line represents the 32 Hz frequency, which is used in Entropy calculation to differentiate EEG activity (<32 Hz) from EMG activity (>32 Hz). In Entropy calculation, low SE value increases rapidly after appearance of EMG, because the power at <32 Hz area increases. (c) EEG spectrogram (frequency vs time) of the same patient as in (a) and (b). Fast activity disappears in the beginning of anaesthesia (0–30 s). Continuous activity below 30 Hz is merely EEG. Placement of oropharyngeal airway (OA) at 1 min 40 s elicits short EMG response, shown as a vertical bar up to 150 Hz. Laryngoscopy and attempted intubation (IA) at arrow is associated with longer EMG response. Replacement of oropharyngeal airway at 3 min 50 s, and successful intubation (Intub) at 4 min 30 s. Long-lasting EMG activity ensues.

