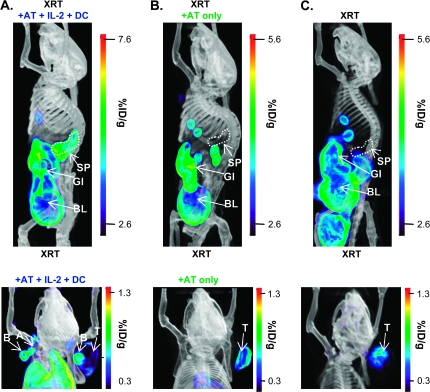
Fig. 2.
[18F]FHBG micro-PET imaging of adoptively transferred T cells in spleen and LNs in mice receiving combined immunotherapy. On day 3 post-AT, mice were imaged with micro-PET/CT 60 min after i.v. injection with [18F]FHBG and Fenestra LC contrast agent. Representative 3D PET/CT images of lymphodepleted mice bearing B16 tumors receiving (A) pmel-1 T cells with gp10025–33/DC vaccine and high-dose IL-2 (XRT + AT + IL-2 + DC), (B) pmel-1 T cells alone (XRT + AT) and (C) no treatment (XRT only) showing the whole body (top panels) and upper body (bottom panels) are presented. %ID/g, percent injected dose per gram of tissue; SP, spleen; GI, gastrointestinal tract; BL, bladder; B, brachial LN; A, axillary LN; T, tumor; GB, gall bladder; E, eye.

