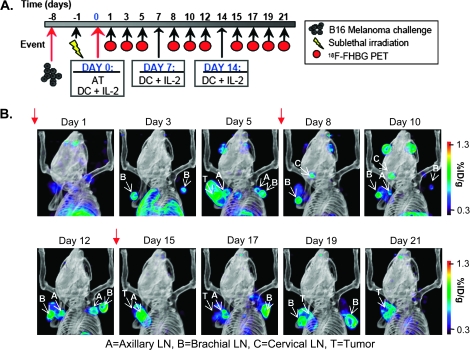
Fig. 4.
Serial [18F]FHBG micro-PET imaging of T-cell persistence at various anatomical locations in mice treated with combined immunotherapy. (A) Time line of the imaging study. (B) Mice were imaged with micro-PET/CT 60 min after i.v. injection with [18F]FHBG. Representative 3D micro-PET/CT images of the same mouse on different days are displayed. Red arrows indicate days that mice received gp10025–33/DC vaccine and high-dose IL-2. A, axillary LN; B, brachial LN; C, cervical LN; T, tumor.

